
A social media report is a short, recurring summary that turns your performance data into decisions: what you did, how it tracked against your goals, and what you will do next. A strong one leads with the metrics that prove business impact — conversions, saves, shares, and DM-driven clicks — and treats reach as context, not the headline. Keep it to one page or five slides.
Most reports get skimmed and forgotten. A manager opens the deck, sees a wall of impressions and follower counts, wonders what any of it means for revenue, and closes the tab. The numbers were real. The framing buried the point.
This guide gives you a report built around one rule: every number maps to a decision. You get the five sections that carry the weight, the metrics worth reporting (and the ones to drop), a copy-paste template, and where to pull the data for Instagram and beyond. It works whether you report to a boss, a client, or just yourself.
Key Takeaways
- A report is a decision tool, not a data dump: every metric you include should answer “so what do we do next month.”
- Lead with impact, not reach: conversions, saves, shares, and DM-driven link clicks belong at the top; impressions and follower counts are context.
- Five sections cover it: headline summary, goal scorecard, what moved and why, the conversion and community layer, and next moves.
- Instagram changed the math: Meta replaced impressions with a single Views metric in April 2025, so year-over-year engagement rates read lower even when nothing actually dropped (Metricool, 2025).
- Native Insights forgets fast: Instagram holds roughly 90 days of data, so export monthly or lose your history (Instagram Help Center, 2026).
- Match cadence to purpose: monthly for check-ins, quarterly for strategy, annual for the big picture.
- Keep it short: one page or five to ten slides beats a 30-metric spreadsheet every time.

What Is a Social Media Report?
Put plainly, it summarizes your key performance metrics, your progress against goals, and the actions you plan next, over a set period (usually a month). Its job is to move a reader from “here is what happened” to “here is what we do about it.” A dashboard shows live numbers; a report tells the story behind them and points forward.
Reporting is the fourth job in social media marketing, and the one most often confused with the first three. The difference between a report people act on and one they ignore rarely comes down to how much data you gathered. It comes down to selection and order. Every number you keep should earn its place by driving a decision. If a metric cannot change what you do next month, it does not belong in the summary. Move it to an appendix or cut it.
The 5-Part Structure That Ties Every Number to a Decision
Skip the 20-slide template. These five sections answer every question a stakeholder actually has, in the order they ask them.
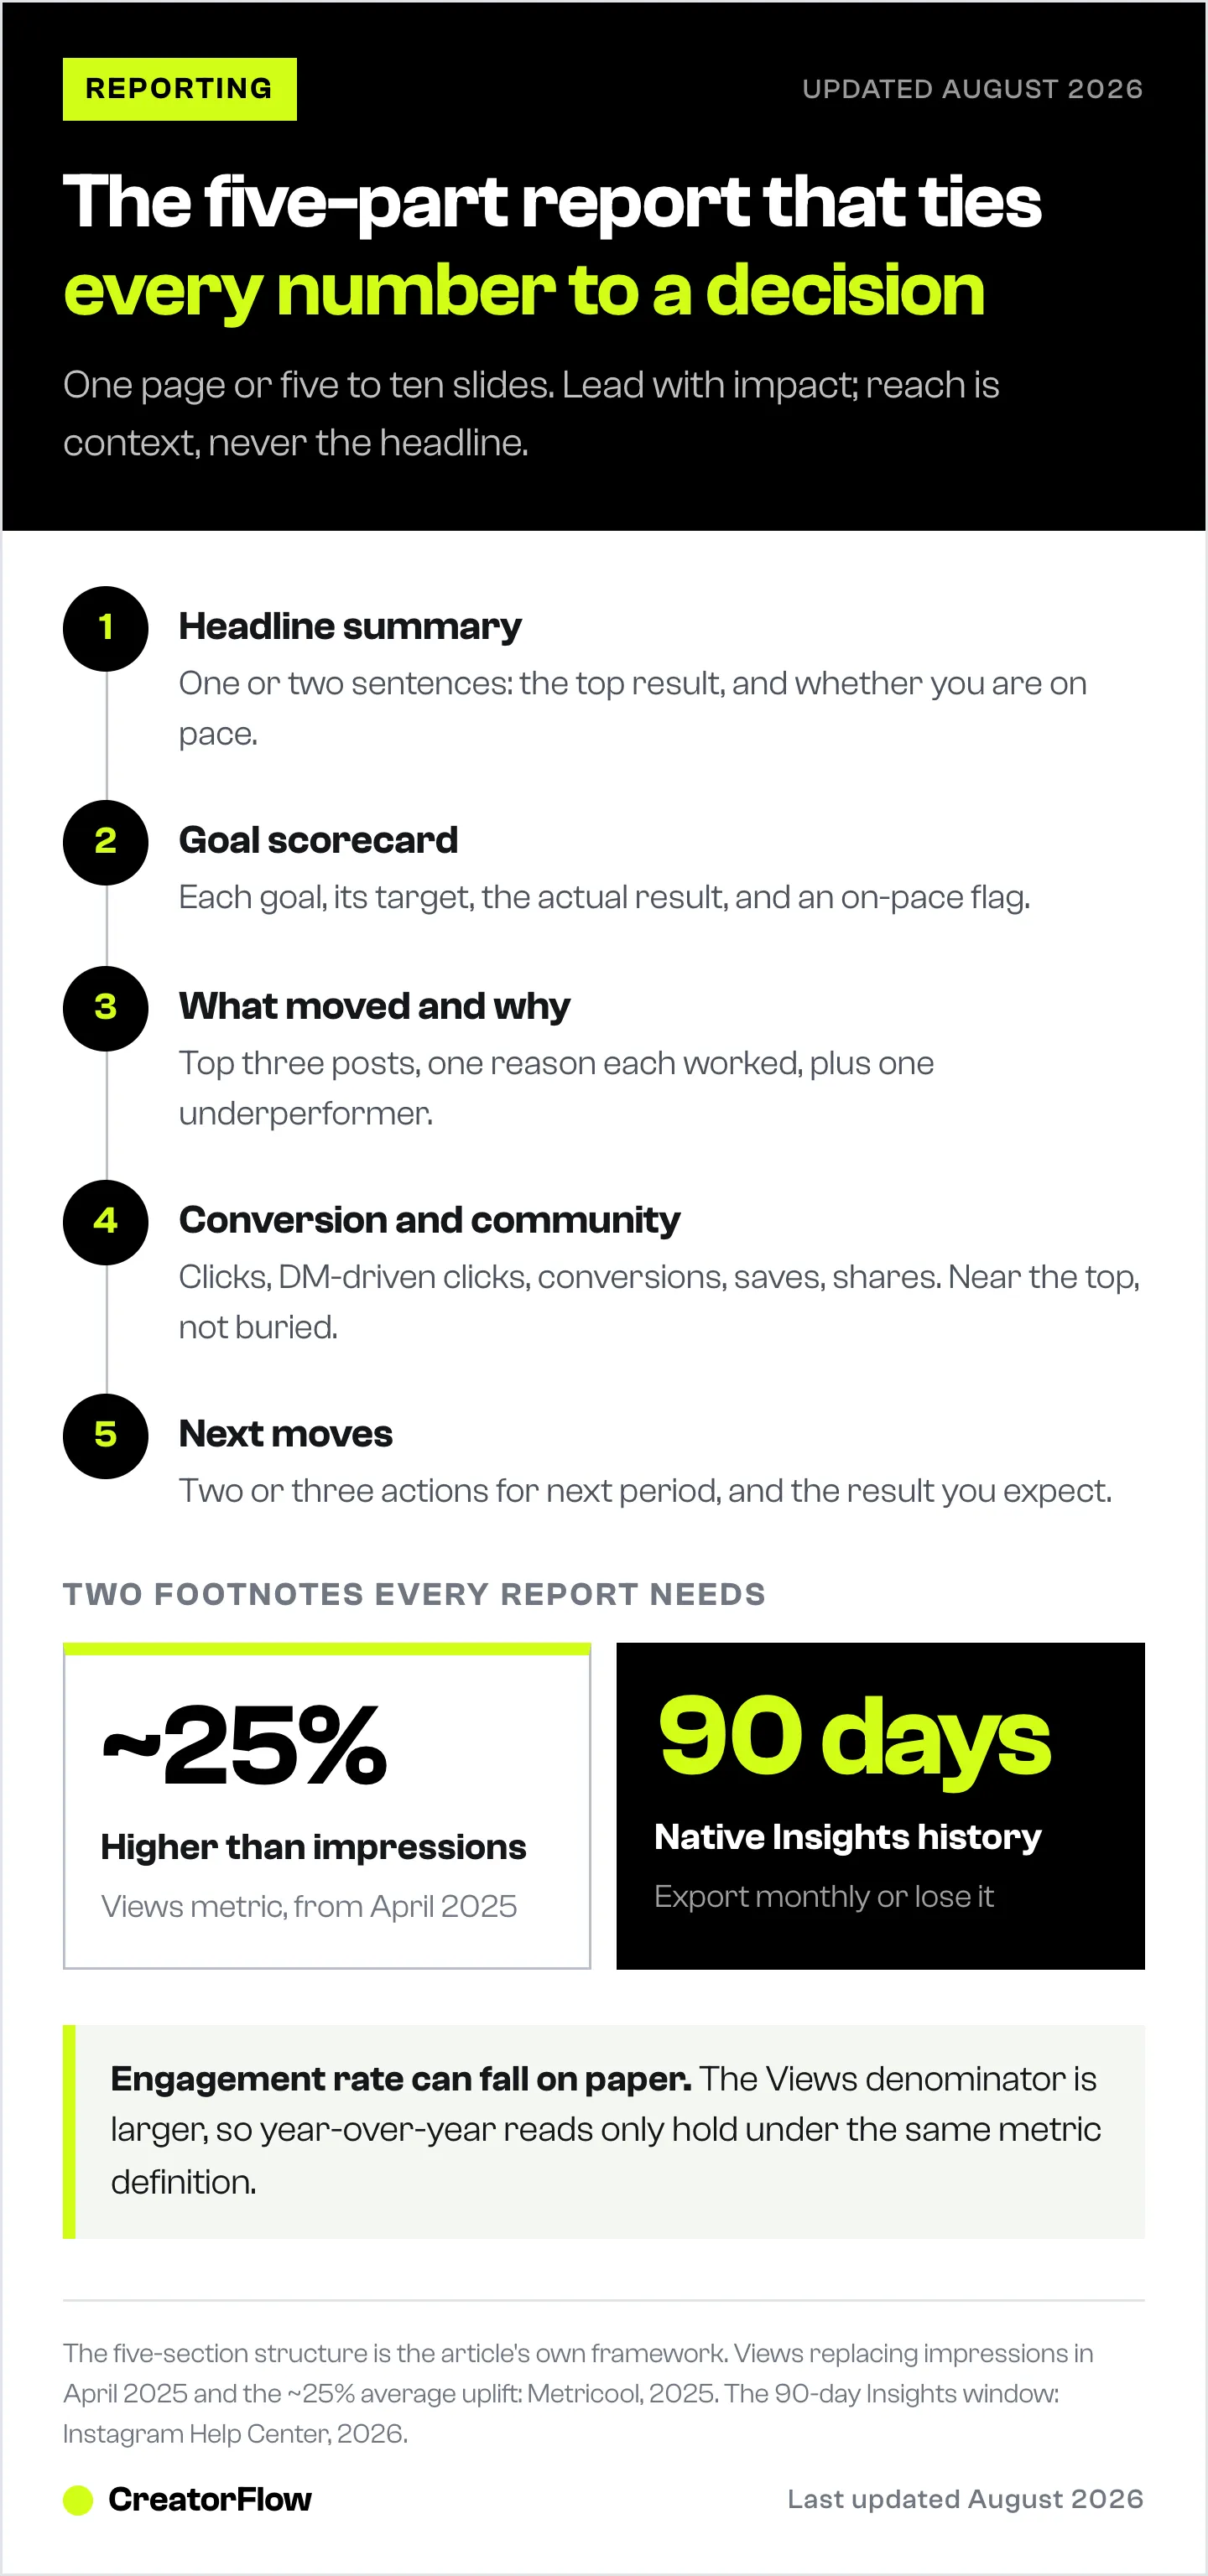
1. Headline summary. One or two sentences: the single most important result and whether you are on pace. Executives read this and nothing else, so make it count. “Sales-driving DM clicks up 34% month over month, on pace for the Q3 target” beats “here are this month’s numbers.”
2. Goal scorecard. Each goal, its target, the actual result, and an on-pace or off-pace flag. This is where you connect activity to the goals you set. If you have not set measurable goals yet, set goals worth reporting on before you build another report, because a report without goals is just trivia.
3. What moved and why. Your top three posts, with a one-line reason each worked, plus one thing that underperformed. Patterns matter more than totals here. If the same Reel drove both the most saves and the most link clicks, you found a repeatable format.
4. The conversion and community layer. Clicks, DM-driven clicks, conversions, saves, shares, and notable comments or DMs. Most templates bury this or skip it. It is the part that proves the account earns its keep, so it goes near the top, not the bottom.
5. Next moves. Two or three specific actions for next period and the result you expect. This turns a backward-looking recap into a plan, which is the difference between “nice update” and “keep funding this.”
The Metrics Worth Reporting, Organized by Goal
Not all metrics carry equal weight, and the ones that matter depend entirely on what you are trying to achieve. Report the metrics tied to your goal first; everything else is supporting context. The table below maps each goal to the metric that proves it and, more importantly, the decision that metric drives.
| Your goal | Metric to report | The decision it drives |
|---|---|---|
| Drive sales or leads | Link clicks, DM-driven clicks, conversions, cost per lead | Double down on the content and offers that convert; cut what does not |
| Build a community | Saves, shares, comments, DM reply rate | Make more of the format people save and send to friends |
| Grow the audience | Follower growth rate, reach from non-followers, profile visits | Judge whether new content reaches new people or just your existing fans |
| Prove awareness | Views, reach, brand mentions | Show the distribution trend and seasonality, not a vanity headline |
| Paid performance | Spend, CPM, CPC, ROAS, paid conversions | Reallocate budget toward the best-returning campaigns |
Notice what leads: the revenue and community rows sit at the top on purpose. For sales accounts, the DM metrics that map to revenue — reply rate, click-through, and conversion rate — deserve their own line. Saves and shares deserve special attention on Instagram because they carry far more algorithmic weight than likes, which shapes how far your next post travels. For a deeper breakdown of which Instagram metrics actually matter and the benchmarks to aim for by follower size, that guide pairs well with this one.
The conversion row is the one most creators cannot fill in, because they never set up tracking. If you send people to a link in your DMs, you want to know how many clicked and where they came from. That is the whole case for tracking link clicks from your DMs with proper attribution instead of guessing.
Why Reach and Impressions Mislead You in 2026
Reporting on reach got more confusing in 2025, and it trips up anyone comparing year over year. In April 2025, Meta deprecated impressions and plays across the Instagram API and folded them into a single Views metric (Metricool, 2025). Views count every time your content was played or displayed, so they run higher than impressions did — roughly 25% higher on average across accounts.
Here is the practical trap. Engagement rate is engagements divided by a reach number. Swap impressions for the larger Views figure in the denominator and the rate drops, even if your actual engagement held steady. A report that shows “engagement rate down 20% year over year” without explaining the metric change tells a false story and invites the wrong decision.
Two fixes. First, compare like with like: only benchmark against data recorded under the same metric definition. Second, footnote the change once in your report so nobody reads a measurement shift as a performance drop. Reach still matters as a distribution and seasonality signal. It just does not belong as the headline number when your goal is sales or community. The financial figure that belongs there instead is worked through in our guide to calculating social media ROI.
Where to Pull the Numbers
You have four practical sources, and most teams use two or three together.
Native platform insights. Instagram’s Professional Dashboard and Insights give you reach, views, engagement, and audience data for free. The catch: native Insights only holds about 90 days of history (Instagram Help Center, 2026). Miss a monthly export and that data is gone. So the first habit of anyone who reports regularly is exporting on a schedule.
A spreadsheet you own. Copy your monthly numbers into a sheet you control. It becomes your permanent record, survives past the 90-day window, and makes month-over-month math trivial. Boring, reliable, and free.
All-in-one social suites. Platforms like Later, Sprout Social, and Buffer pull multi-platform metrics into one dashboard and export them for you, which saves manual collection when you post across several networks (Later, 2026). They are strongest for teams reporting on four or more platforms at once.
DM and link-conversion tracking. Native tools stop at reach and engagement. They do not show how many people clicked the link you sent in a DM or where those clicks came from. CreatorFlow fills that gap for Instagram creators: it runs your comment-to-DM and keyword automations, then tracks link clicks by post and by country so the conversion row of your report is real data, not a guess. For agencies presenting to clients, that attribution is the whole story, which is why client-facing reports for agencies lean on it heavily.
How Often Should You Report?
Cadence should match the decision it feeds. Report too often and you drown people in noise; report too rarely and problems fester for a quarter before anyone notices.
| Cadence | Best for | Depth |
|---|---|---|
| Weekly snapshot | Launches and live campaigns | 3-4 numbers, no narrative |
| Monthly | Regular check-ins (the default) | 1 page or 5-10 slides |
| Quarterly | Strategy pivots and goal pacing | Deeper trend analysis |
| Annual | Budget talks and year-over-year | Big-picture ROI story |
Monthly is the right default for most teams. It gives you enough data to spot a trend without turning reporting into a full-time job. Add weekly snapshots only when a launch is live and you need to react fast.
A Copy-Paste Social Media Report Template
Lift this structure straight into a doc or slide deck. Fill the brackets, delete the prompts, and you have a monthly report in under 15 minutes.
Headline (1-2 sentences). [Single most important result this month] and [on pace / behind pace] for [goal].
Goal scorecard (table). For each goal: Goal name | Target | Actual | On pace? | One-line note.
What moved and why (3 posts). For each top post: what it was | the metric it won | the one reason it worked. Then one underperformer and your read on why.
Conversion and community layer. Link clicks | DM-driven clicks | conversions | cost per lead | saves and shares | one standout comment or DM theme from your audience.
Next moves (2-3 actions). Action | why you are doing it | the result you expect | how you will measure it.
Footnotes. Any metric definition changes (for example the Views shift), date ranges, and data sources.
To calculate month-over-month growth for any line, subtract last month from this month, divide by last month, and multiply by 100. Going from 436 to 562 followers is (562 - 436) / 436 x 100, which is 29% growth.
Reporting Mistakes That Get Your Report Ignored
- Leading with reach. Impressions and follower counts up top signal “we have nothing better to show.” Open with impact.
- Reporting every metric you can access. Volume reads as insecurity. Ten numbers tied to goals beat forty numbers tied to nothing.
- No period-over-period context. A single number floating alone means nothing. Always show the change and the direction.
- Numbers without a “so what.” “Engagement up 15%” is trivia until you add “putting us ahead of pace on the Q3 awareness goal.”
- Ignoring the DMs. The questions and objections in your comments and DMs are free market research. Surface the recurring themes.
- No next steps. A report that only looks backward gets read once. One that ends with a plan gets you a bigger budget.
If your metrics never seem to land with leadership, the issue is almost always framing rather than performance. Translate every number into a business outcome and the same data suddenly reads as a win.
FAQ
What is a social media report?
A social media report is a document that summarizes your key performance metrics, your progress toward goals, and your planned next steps over a set period, usually a month. It helps stakeholders understand what worked, what did not, and what to do next, without wading through raw analytics.
What should I include in a social media report?
Include five things: a headline summary, a goal scorecard, your top-performing posts with the reason each worked, a conversion and community layer (clicks, DM-driven clicks, conversions, saves, shares), and two or three next moves. Skip metrics that cannot change a future decision.
What metrics should I track in a social media report?
Track the metrics tied to your goal first. For sales, report link clicks, DM-driven clicks, and conversions. For community, report saves, shares, and DM reply rate. For growth, report follower growth rate and reach from non-followers. Keep views and impressions as context, not the headline.
How often should I create a social media report?
Monthly works for most teams as a regular check-in. Use quarterly reports for deeper strategy reviews and goal pacing, and annual reports for budget conversations and year-over-year comparisons. Add weekly snapshots only during launches or live campaigns when you need to react quickly.
What is the difference between a social media report and a dashboard?
A dashboard shows live, continuously updated metrics for day-to-day monitoring. A report is a static summary of a specific period, built for a stakeholder audience, that adds narrative, context, and next steps. Dashboards answer “what is happening now”; reports answer “what does it mean and what do we do.”
How do I calculate month-over-month growth for social media?
Subtract the previous month’s value from the current month’s value, divide by the previous month’s value, then multiply by 100. For example, going from 436 to 562 followers is (562 - 436) / 436 x 100, which equals 29% growth.
How long should a social media report be?
A monthly report should be concise: one page or five to ten slides. Lead with the headline and save the detailed trend analysis for quarterly reviews. Length is not the goal; clarity is. A report a busy executive can absorb in two minutes beats an exhaustive one nobody finishes.
Why did my Instagram engagement rate drop year over year?
It may not have. Meta replaced impressions with a larger Views metric in April 2025, and engagement rate calculated against the bigger number reads lower even when engagement held steady. Compare only data recorded under the same metric definition, and footnote the change in your report so it is not misread as a decline.
Instagram metric definitions verified from Metricool and the Instagram Help Center as of July 2026. CreatorFlow features and pricing verified from creatorflow.so. Individual results vary.


