
Social media ROI is the value social media generates minus what it cost, divided by that cost, shown as a percentage. A result of 200% means every $1 spent returned $2 of value. The arithmetic is simple. The difficulty is that most costs go uncounted and most returns arrive through channels that strip their own tracking data before any analytics tool sees them.
You spent 14 hours on Instagram last month, paid $45 in tools, and your analytics reports zero revenue from social. Direct traffic is up. Three customers told you on a call that they found you on Instagram. Both numbers are wrong: the one in the dashboard and the one in your head.
This guide covers the formula, the cost stack almost everyone undercounts, the three returns worth counting separately, and the specific mechanical reason your reported figure is lower than reality. It is written for small teams and solo operators who need a number they can defend, not another dashboard.
Key Takeaways
- The formula is (return minus cost) divided by cost, times 100: a 200% result means $2 back for every $1 in, and anything above 0% is profitable before opportunity cost
- Use gross profit, not revenue, in the numerator: a 45% margin store reporting “297% ROI” on revenue is really at 102%, and the gap is entirely arithmetic
- Your own hours are the largest cost line in most small accounts: leaving them out inflated the worked example below from 102% to 399%
- Measuring ROI is marketing’s top reported challenge: 33% of marketers named it the number one problem in HubSpot’s 2026 State of Marketing survey (blog.hubspot.com, August 2026)
- The platforms erase their own referral data: in a controlled test, 100% of visits from TikTok, WhatsApp, Slack and Discord arrived with no referral information at all and were logged as direct traffic (sparktoro.com, August 2026)
- The top barrier is structural, not analytical: 35.94% of marketers named platform restrictions on outbound links as the main obstacle to social attribution (blog.hubspot.com, August 2026)
- Fix the numerator rather than the model: a tracked link inside a conversation you started produces attribution that no downstream model has to reconstruct
What Is Social Media ROI?
Social media ROI is the financial return social media activity produces relative to everything it costs to run. It is expressed as a percentage of spend recovered. The measurement covers organic and paid activity together, counts staff and freelance time as real money, and values returns in gross profit rather than top-line revenue. A negative figure means the channel consumed more than it produced during the period measured.
The term gets used loosely to mean “did social work,” which is why so many reported figures are not comparable to each other. One team counts ad spend only. Another counts ad spend plus tools. A third counts a founder’s 20 hours a week at zero. Those three numbers describe the same performance and differ by an order of magnitude.
The Social Media ROI Formula
The standard formula is:
Social media ROI = ((Return - Cost) ÷ Cost) × 100
Two substitutions turn it from a flattering number into a usable one.
Substitute gross profit for revenue. Revenue in the numerator overstates every result, and the size of the error scales with how thin your margins are. Take $6,000 of orders attributed to social against $1,200 of cost. On revenue, that reads as 400%. At a 35% gross margin the actual profit is $2,100, and the honest figure is 75%. Both describe the same month. Only one survives a conversation with an accountant.
Substitute realized value for projected lifetime value. Lifetime value belongs in a forecast, not in a ROI calculation for a month that has already closed. Value a captured email at what your list has historically produced in its first 60 or 90 days, then let the rest show up in later periods when it actually arrives.
Count Every Cost, Not Just Ad Spend
The cost side is where most calculations quietly break. Ad spend is the easiest line to find and usually the smallest one.
| Cost line | How to price it | Commonly missed |
|---|---|---|
| Paid promotion | Platform billing | No |
| Scheduling and analytics tools | Monthly subscription | No |
| Automation and messaging tools | Monthly subscription, plus per-contact overage | Overage only |
| Freelance editing, design, photography | Invoices for the period | No |
| Your own production time | Hours worked at your billable or replacement rate | Almost always |
| Team time across other functions | Hours worked at loaded salary cost | Almost always |
| Paid content or gifted product | Cost of goods, not retail price | Often |
Two lines deserve attention because they behave differently from the rest.
Your own time is a real cost. If you would otherwise bill those hours, price them at your rate. If you would not, price them at what hiring a replacement would cost. Either way the number is not zero, and treating it as zero is the single biggest reason small accounts report ROI figures in the hundreds of percent while their bank balance stays flat.
Some tool costs scale with success. Contact-based pricing means the bill grows as the channel works. ManyChat, for example, bills on active contacts, defined as any person you interact with during a billing period regardless of message volume: Essential is $17 a month monthly-billed or $14 billed annually for up to 250 active contacts, and the Pro tier covers 2,500 with additional contacts charged at $0.05 each monthly or $0.038 annually (manychat.com/pricing and help.manychat.com, August 2026). A flat monthly rate holds the cost line still while the return line moves, which changes the shape of the curve rather than one entry on it. Whether the tool itself clears its own cost is a separate calculation, worked through in our breakdown of whether a $15 automation tool pays for itself.
The Three Returns Worth Counting Separately
Collapsing every kind of return into one figure hides which part of the channel is working. Track three numerators and report them as three lines.
Direct revenue. Orders, bookings and signups that carry a tracked link back to a social touchpoint. Convert to gross profit before it enters the formula. This is the only line most guides count.
Captured contact value. Emails, phone numbers and messaging subscribers collected through social, valued at realized performance rather than projection. If 260 subscribers historically produce $1.10 of gross profit each within 90 days, that month’s capture is worth $286. This line is the reason organic social can post a positive return with no attributable orders at all, and it depends on what the platform actually lets you keep, which we set out in the breakdown of Instagram first-party data.
Recovered time. Hours no longer spent answering the same question by hand. This one is a cost reduction, not new money, so subtract it from the cost side rather than adding it to the return side. Adding it to both is double-counting, and it is common.
Why Your Social Media ROI Reads Lower Than It Is
Reported social ROI is systematically low because the platforms strip referral data on exactly the surfaces where social conversations happen. Analytics tools then file those visits as direct traffic, and direct traffic gets credited to nothing. The loss is mechanical, it happens before any attribution model runs, and no choice of model recovers it.
The clearest evidence comes from a controlled experiment rather than a survey. Sixteen unique URLs were placed on a clean subdomain with no other inbound links or prior traffic, instrumented with Google Analytics, and shared one platform at a time (sparktoro.com, August 2026). The results:
| Where the link was shared | Visits arriving with no referral data |
|---|---|
| TikTok, WhatsApp, Slack, Discord, Mastodon | 100% |
| Facebook Messenger | 75% |
| Instagram direct messages | 30% |
| LinkedIn posts | 14% |
| Pinterest posts | 12% |
Every one of those visits is logged as direct. A channel that produced them looks like it produced nothing.
This is not a reporting quirk to work around later. It is the reason 33% of marketers named ROI measurement their top challenge in HubSpot’s 2026 State of Marketing survey, and why 35.94% pointed at platform restrictions on linking out as the specific barrier to social attribution (blog.hubspot.com, August 2026). Reach without a clickable, taggable destination cannot be measured by anything downstream.
The second distortion runs the other way and inflates the denominator’s apparent job. Organic reach has been falling: Instagram engagement dropped roughly 24% year over year, with the platform average sitting at 0.45% in Q2 2026 against 0.70% for what the same dataset calls a good rate (socialinsider.io, August 2026). Flat effort now buys less distribution than it did, so a stable ROI figure across two years actually represents improving execution.
Fix the Numerator, Not the Attribution Model
Given the table above, the productive response is not a better model. Multi-touch attribution, media mix modelling and last-click all operate on data the platform already deleted. The response that works is to create the tracked event yourself, inside a conversation you started.
Four steps, in order of how much they recover:
- Tag every outbound link with UTM parameters. Source, medium and campaign, applied consistently. A link you tagged carries its own attribution and never depends on a referrer header. The full setup, including the Google Analytics 4 configuration, is in our Instagram DM automation analytics guide.
- Move the link into the message. A link sent inside a DM is clickable, taggable and attributable in a way a caption or a Reel overlay is not. This is what turns the platform’s outbound-link restriction from a measurement ceiling into a routing decision.
- Use one campaign value per post or offer. Reusing one tag across thirty posts destroys attribution at the source. Distinct values make the return line traceable to a specific piece of content rather than to “Instagram.”
- Ask at the point of purchase. A single optional “how did you hear about us” field on checkout catches what the tracking cannot. Treat it as directional, never as the primary number, and never reconcile the two into an average.
Two of those four cost nothing and take an afternoon. They also produce the per-post detail that makes the monthly figure actionable rather than merely defensible.
What Counts as a Good Social Media ROI
There is no cross-industry benchmark worth planning against, because a good figure depends entirely on gross margin. A 300% return is strong for a software business at 80% margins and marginal for a retailer at 25%. Published averages in the 250% to 500% range circulate widely, and almost all of them are calculated on revenue rather than gross profit, which makes them roughly three times higher than the same performance measured properly.
Three comparisons are more useful than any published average:
- Against your other channels. Social ROI only means something next to email, search and paid, calculated the same way with the same cost rules applied to each.
- Against your own trailing three months. A trend on consistent inputs beats a snapshot against someone else’s definitions.
- Against zero, honestly. Positive after your own time is priced in is a genuine result, and plenty of accounts reporting 400% are below it.
For platform-level numbers worth tracking alongside the financial figure, our guide to which Instagram metrics predict growth covers the five that move ahead of revenue.
A Worked Example, End to End
One month, a small product business selling at a 45% gross margin.
Costs
| Line | Amount |
|---|---|
| Own production time (18 hours at $40) | $720 |
| Freelance editor | $250 |
| Scheduling tool | $25 |
| DM automation tool | $15 |
| Paid boost | $200 |
| Total cost | $1,210 |
Returns
| Line | Amount |
|---|---|
| Tracked orders (revenue) | $4,800 |
| Gross profit on those orders (45%) | $2,160 |
| 260 emails captured, at $1.10 realized in 90 days | $286 |
| Total counted return | $2,446 |
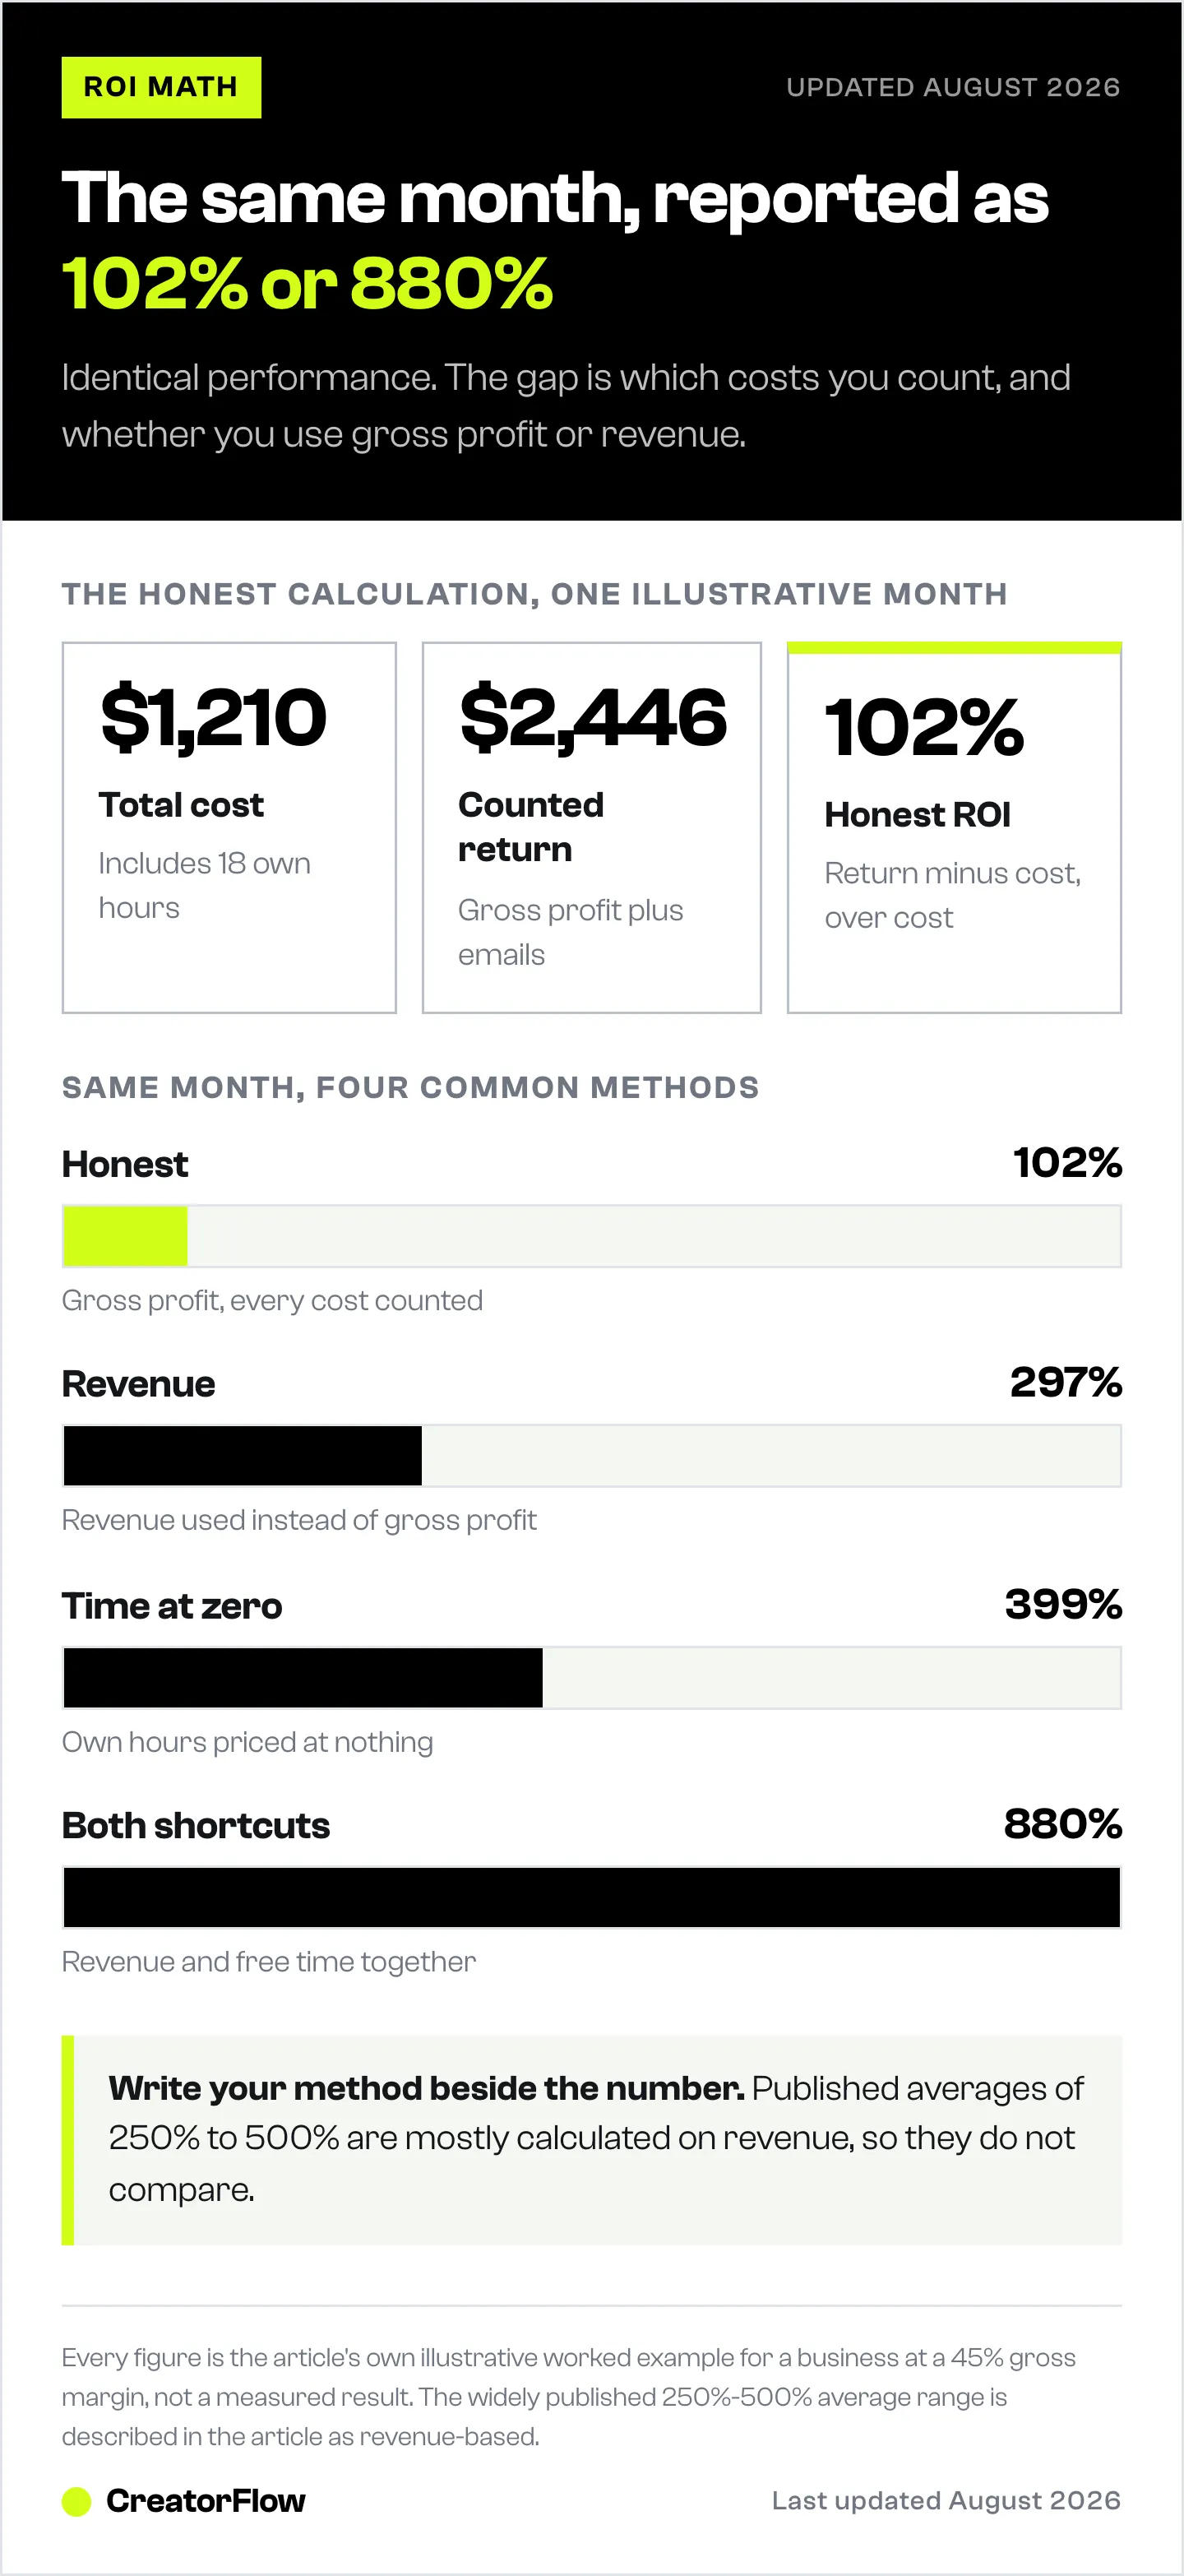
Honest ROI: ($2,446 - $1,210) ÷ $1,210 = 102%.
Now the same month calculated three other ways, each using an assumption in common use:
| Method | Return used | Cost used | Reported ROI |
|---|---|---|---|
| Gross profit, all costs counted | $2,446 | $1,210 | 102% |
| Revenue instead of gross profit | $4,800 | $1,210 | 297% |
| Own time valued at zero | $2,446 | $490 | 399% |
| Both shortcuts together | $4,800 | $490 | 880% |
Identical performance, reported between 102% and 880%. This is why comparing your figure to a published benchmark tells you almost nothing, and why writing your method down next to the number matters more than the number. The reporting structure that keeps those definitions stable month to month is covered in our walkthrough of how to build a social media report.
FAQ
How do you calculate social media ROI?
Subtract total cost from total return, divide by total cost, and multiply by 100. Use gross profit rather than revenue in the return, and include your own hours at your billable or replacement rate in the cost. A result of 100% means the channel doubled the money put into it during that period.
What is a good social media ROI?
It depends on your gross margin, so there is no portable benchmark. A 300% return is strong at 80% margins and thin at 25%. Averages in the 250% to 500% range are widely published but are almost always calculated on revenue rather than gross profit, which inflates them by roughly three times against a properly calculated figure.
How do you measure ROI on organic social media with no ad spend?
The cost side becomes time plus tools rather than time plus tools plus media. Price your hours, add subscriptions, and count captured contacts as a return line alongside any tracked orders. Organic accounts often post their entire positive return through contact capture rather than direct sales, which is invisible if you only count orders.
Should you include your own time as a cost?
Yes. It is usually the largest line. In the worked example above, excluding it moved the reported figure from 102% to 399% with no change in actual performance. Price it at what you would bill for those hours, or at what replacing yourself would cost, whichever reflects the real trade-off.
Why does Google Analytics show social traffic as direct?
Because several platforms send no referral information at all. In a controlled test, 100% of visits from TikTok, WhatsApp, Slack, Discord and Mastodon arrived with no referrer and were classified as direct, along with 75% of Facebook Messenger visits and 30% of Instagram DM visits (sparktoro.com, August 2026). UTM parameters survive this, because the tag travels in the link itself.
How long before social media ROI turns positive?
Contact capture and repeat purchasing both lag the month they were earned in, so a single month understates a channel that is working. Calculate monthly for the operating decisions, then read the trailing three-month figure before deciding whether to cut or fund the channel. Judging a channel on one month’s tracked orders is the most common way a profitable one gets shut down.
Does social media ROI include brand awareness?
Not in the formula. Awareness has no defensible currency value, and assigning one turns the calculation into an argument. Report reach and engagement separately as context, and keep the ROI line restricted to gross profit and realized contact value. A figure that survives scrutiny is worth more than a larger one that does not.
Make the Return Line Traceable
Attribution gets easier when the click starts in a conversation you can tag. CreatorFlow is a Meta Tech Provider (since December 2025) that replies to comments, story replies and keywords with a DM in seconds, carries your tagged link inside that message, and reports click-through rate and buyer location for every automation. Pro is $15 a month flat, so the cost line stays still while the return line moves.
Marketing challenge and social attribution barrier figures verified at blog.hubspot.com, referral-data experiment results at sparktoro.com, Instagram engagement benchmarks at socialinsider.io, and ManyChat contact pricing at manychat.com and help.manychat.com, all in August 2026. Worked example figures are illustrative. Individual results vary.


