

The value of one automated DM is click rate multiplied by conversion rate multiplied by order value. A message sent to 100 people, clicked by 30, converting 3, on a 50 order, produces 150 across those 100 sends, or 1.50 per DM. Every input is a number you can read from your own automation and store, so this is arithmetic rather than an estimate. The figures here are illustrative and yours will differ.
The decision in front of most people is whether a monthly subscription is returning anything, and the usual way of answering it is a feeling about whether things seem busier. That is not an answer, and it is why tools get cancelled that were working and kept that were not.
This article gives the calculation, the four inputs and where to find each one, a worked example at three different offer prices, and the honest limits of the result.
Key Takeaways
- Four inputs: DMs sent, click rate, conversion rate, average order value.
- Order value dominates. Doubling your price does more than doubling your click rate.
- Use your own numbers. Any benchmark you read, including the ones here, is somebody else’s business.
- Click rate diagnoses the message. Conversion rate diagnoses the offer or the landing page.
- The calculation undercounts, because attribution misses screenshots and cross-device journeys.
- Volume is the fifth input. A high value per DM on ten sends a month is still ten sends a month.
How to Calculate the Value of One Automated DM
Two forms of the same thing. Use whichever you find easier to hold.
Per DM:
click rate × conversion rate × average order value = value per DM
Per automation:
DMs sent × click rate × conversion rate × average order value = revenue from that automation
Worked through with round numbers, chosen for clarity rather than as a prediction:
| Input | Value |
|---|---|
| DMs sent | 100 |
| Clicked the link | 30 (30%) |
| Bought | 3 (10% of clickers) |
| Average order value | 50 |
| Revenue | 150 |
| Value per DM | 1.50 |
The number that matters for a subscription decision is the last one, multiplied by how many DMs you actually send in a month. At 1.50 per DM, 400 sends a month is 600 of attributable revenue.
Where Each Input Comes From
None of these is a guess if your links are tagged.
DMs sent. Your automation tool reports this per automation. It is the only input you get for free.
Click rate. Clicks divided by DMs sent, again from the automation. This is the number that tells you whether the message works. A low click rate on a high-intent trigger means the message is wrong, not the audience.
Conversion rate. Orders divided by clicks. This comes from your store or analytics, and only if the link carried a UTM tag. Without the tag the traffic arrives anonymous and this input is unavailable. The setup takes ten minutes and is in tracking what your Instagram DMs sold.
Average order value. From your store. Use the average for orders arriving from this source rather than your overall average, because DM traffic often buys differently from search traffic.
CreatorFlow reports sends, clicks and click geography per automation through Meta’s official Instagram API, which covers the first two inputs. The last two come from your own store and analytics, which is where order data lives.
Order Value Moves the Number Most
Run the same calculation at three prices and the asymmetry is obvious.
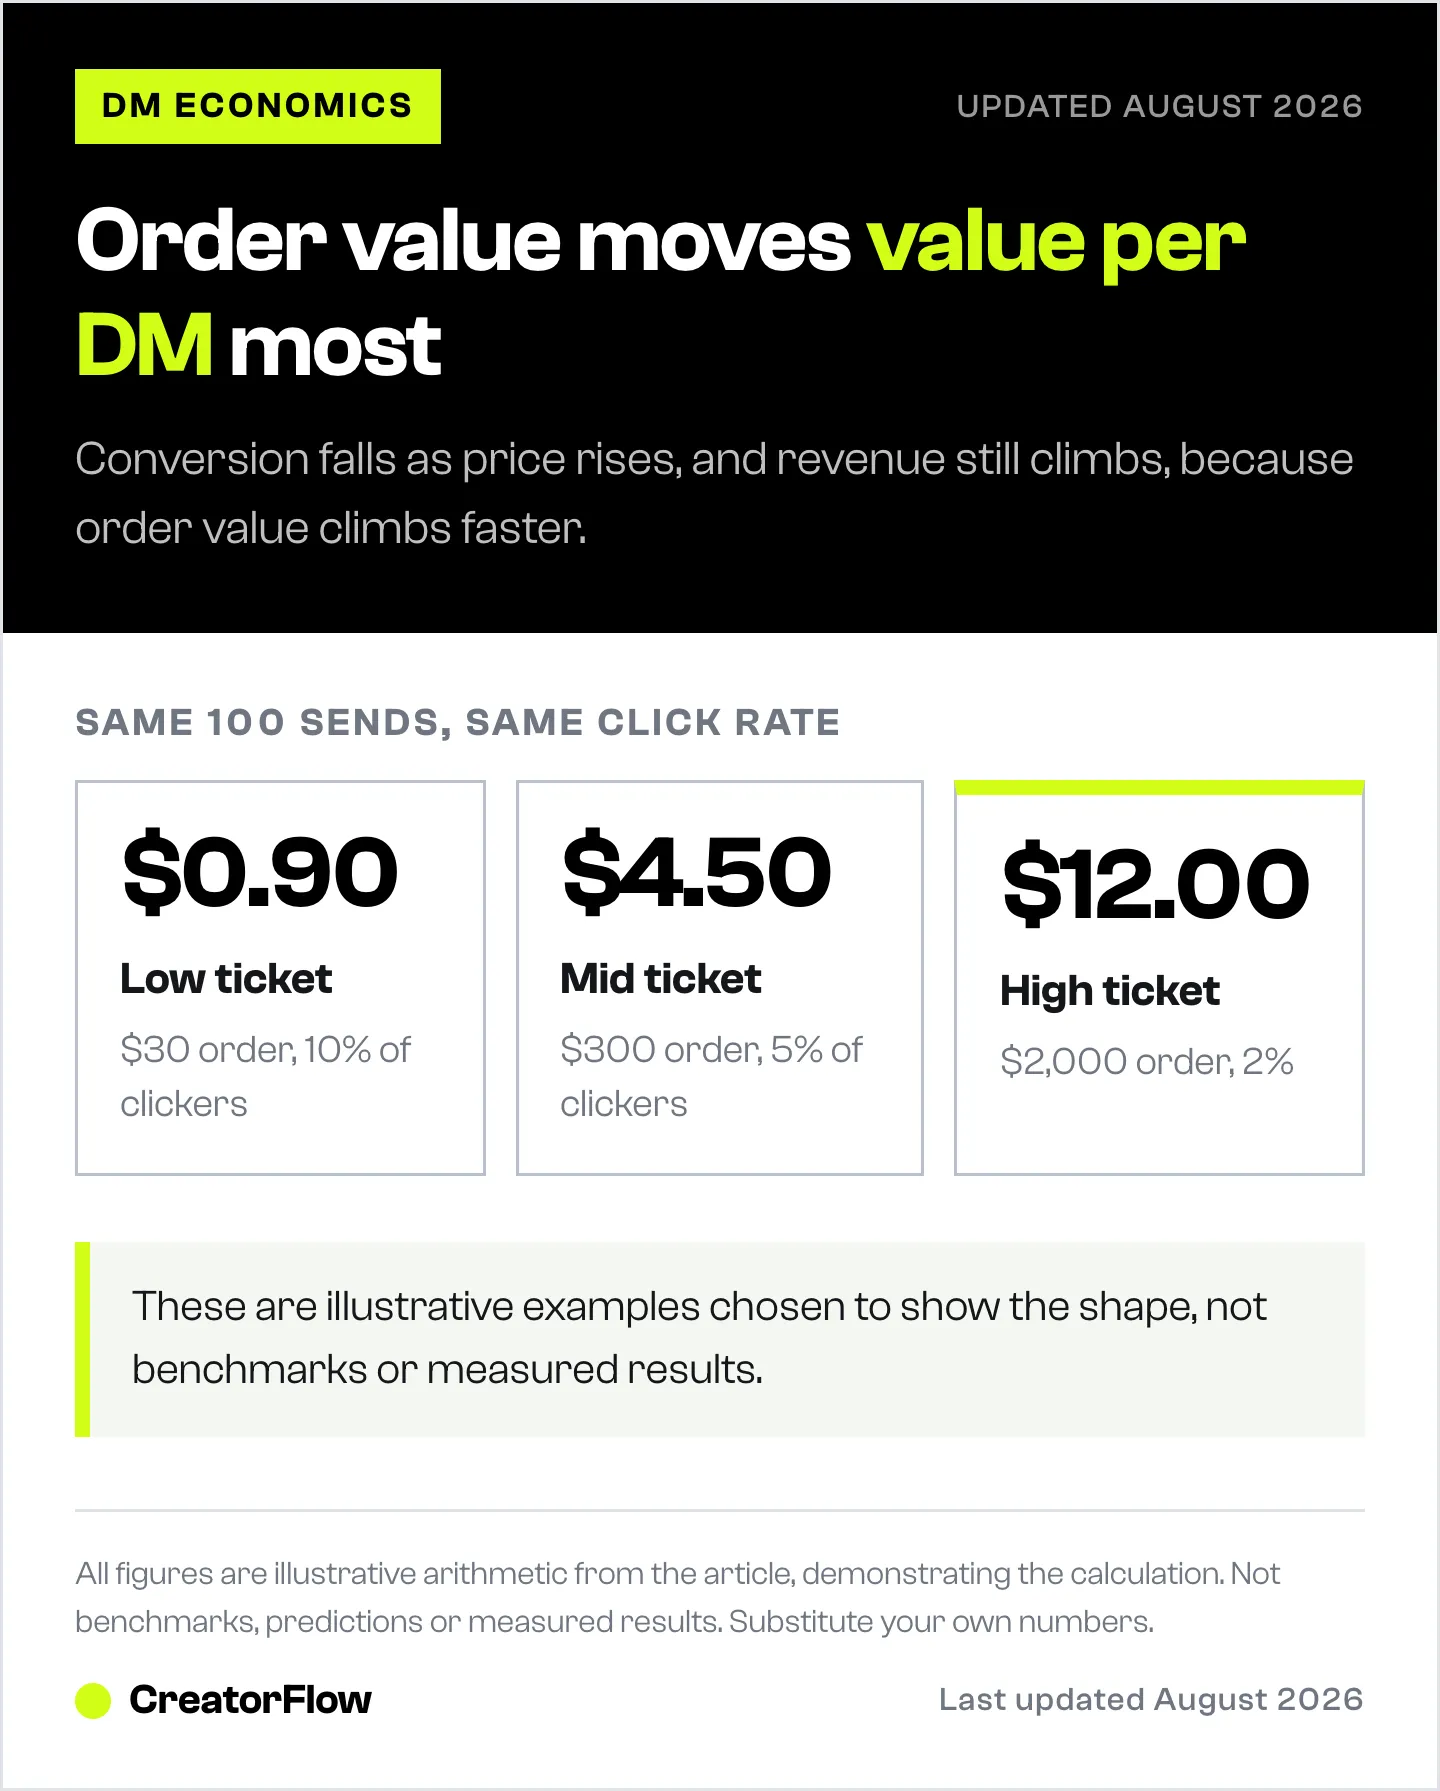
| Low ticket | Mid ticket | High ticket | |
|---|---|---|---|
| DMs sent | 100 | 100 | 100 |
| Click rate | 30% | 30% | 30% |
| Conversion of clickers | 10% | 5% | 2% |
| Order value | 30 | 300 | 2,000 |
| Revenue | 90 | 450 | 1,200 |
| Value per DM | 0.90 | 4.50 | 12.00 |
Conversion falls as price rises, and revenue still climbs, because order value climbs faster than conversion falls. That pattern is the argument for selling something priced properly rather than something priced to be easy, and it is developed in pricing an offer for an Instagram audience.
These conversion figures are illustrative and chosen to show the shape. Substitute your own before making any decision.
Reading the Result
The two rates diagnose different problems, and knowing which one is low tells you what to fix.
| Symptom | Likely cause | What to change |
|---|---|---|
| Low click rate | The message | Shorter, clearer, link earlier, one ask |
| High clicks, low conversion | The landing page or the price | Match the page to what the DM promised |
| Both healthy, low revenue | Volume | More posts that trigger the automation |
| Good revenue, few sends | Reach | The trigger post is not being seen |
The fourth row is the most common in practice. Creators build a well-converting automation and attach it to one post that reaches four thousand people, then conclude automation does not work. The value per DM was fine; there were 40 DMs.
The Honest Limits
Four reasons the calculated number understates reality, and one reason it can overstate it.
Understating:
- Screenshots and typed URLs arrive as direct traffic and never attribute.
- Cross-device journeys count as two people in most analytics setups.
- Delayed purchases can fall outside the attribution window.
- Blocked tracking removes a share of sessions entirely.
Overstating:
- Some of those buyers would have bought anyway. The automation may have shortened the path rather than created the sale. Nothing in this calculation separates the two, and no consumer tool does.
The practical reading: treat the figure as a floor for comparing automations against each other, and be sceptical of it as an absolute claim about incremental revenue. Comparing two of your own automations is reliable, because both are undercounted the same way.
Volume Is the Input People Forget
A high value per DM on a small number of sends is a good rate on a small business. The calculation has a fifth term that sits outside the formula: how many DMs get sent at all.
Three things raise it, in order of effect:
- More trigger posts. One automation on one post produces one post’s worth of DMs. Five posts a week pointing at the same automation produce five times as many.
- Better trigger placement. The keyword needs to be in the caption, said out loud in the Reel, and on screen. Most missed triggers are people who did not notice there was one.
- Triggers on content that already performs. Attaching an automation to your best-performing post format is free volume.
Once volume is real, the payback question becomes answerable, which is covered in how long Instagram DM automation takes to pay for itself.
FAQ
How do you calculate the ROI of Instagram DM automation?
Multiply click rate by conversion rate by average order value to get the value of one DM, then multiply by the number of DMs you send in a month. Compare that against the subscription cost. Every input except conversion rate comes from your automation tool; conversion comes from your store.
What is a good click rate on an automated DM?
Rather than chase a published benchmark, compare your automations against each other. A message triggered by a high-intent comment should click far better than one triggered by a general keyword, and the gap between your own automations is more informative than any external figure.
Why is my click rate high but nobody buys?
The message and the destination do not match. Somebody clicked expecting what the DM promised and landed on something else, usually a homepage instead of the specific product or offer. Point the link at exactly the thing the message described.
Does DM automation actually create sales or just move them?
Some of both, and no consumer analytics setup can fully separate them. The automation certainly removes delay, and delay is where interest dies. Treat attributed revenue as a floor and as a fair way to compare automations, not as a claim about purely incremental sales.
How many DMs do you need to send for this to be worth it?
That depends entirely on your value per DM. Work out that figure first, then divide your monthly tool cost by it to get the number of sends you need. The answer is usually smaller than people expect for higher-priced offers.
Should you count email addresses collected as value?
Yes, separately. An email captured is not revenue today, and it is a contactable person after the messaging window closes. Track it as its own number rather than folding it into the revenue calculation, so you do not double count.
What if you sell a service and there is no online checkout?
Substitute enquiries for clicks and closed deals for conversions, and use your average project value. The arithmetic is identical. The inputs come from your own record of conversations rather than from a store.
All figures in this article are illustrative examples chosen to demonstrate the calculation, not benchmarks, predictions or measured results. Substitute your own numbers. Attribution coverage varies by analytics configuration and browser privacy settings. Individual results vary.


