

There is no reliable country-by-country rate card for Instagram brand deals, and the published ones contradict each other. Two of the most cited 2026 sources give ranges for the same micro tier that differ by roughly ten times. What does exist, with a stated methodology, is CPM data for specific markets. Pricing off your own reach and a market CPM is more defensible than any follower-tier table.
You want a number. You search “Instagram influencer rates UK”, find four rate cards, and they say £50 to £250, £100 to £500, £250 to £1,000 and £250 to £1,500 for a creator with the same follower count. So you pick one, quote it, and have no idea whether you left money on the table or priced yourself out.
This article covers what the published data actually says when you check the sources, why country rate cards are unreliable, the one type of country-level figure that has a methodology behind it, and how to build a rate from your own numbers instead.
Key Takeaways
- Rate cards contradict each other. Two widely cited sources put micro-tier Instagram Stories at $100 to $500 and $500 to $3,000 respectively (influencermarketinghub.com and modash.io, August 2026).
- Most country tables have no methodology. No sample size, no collection date, no stated source.
- CPM data is the exception. Practitioner CPM bands come with a stated basis and are the most usable published figures.
- Your own reach is the input that matters, not your follower count. Follower tiers ignore the number brands actually buy.
- Format changes price more than country does. Reels routinely price above Stories in every published set.
- Usage rights and exclusivity often exceed the base fee. A rate quoted without them is not a rate.
What the Published Sources Actually Say
Check the two most cited rate guides against each other and the problem is immediate.
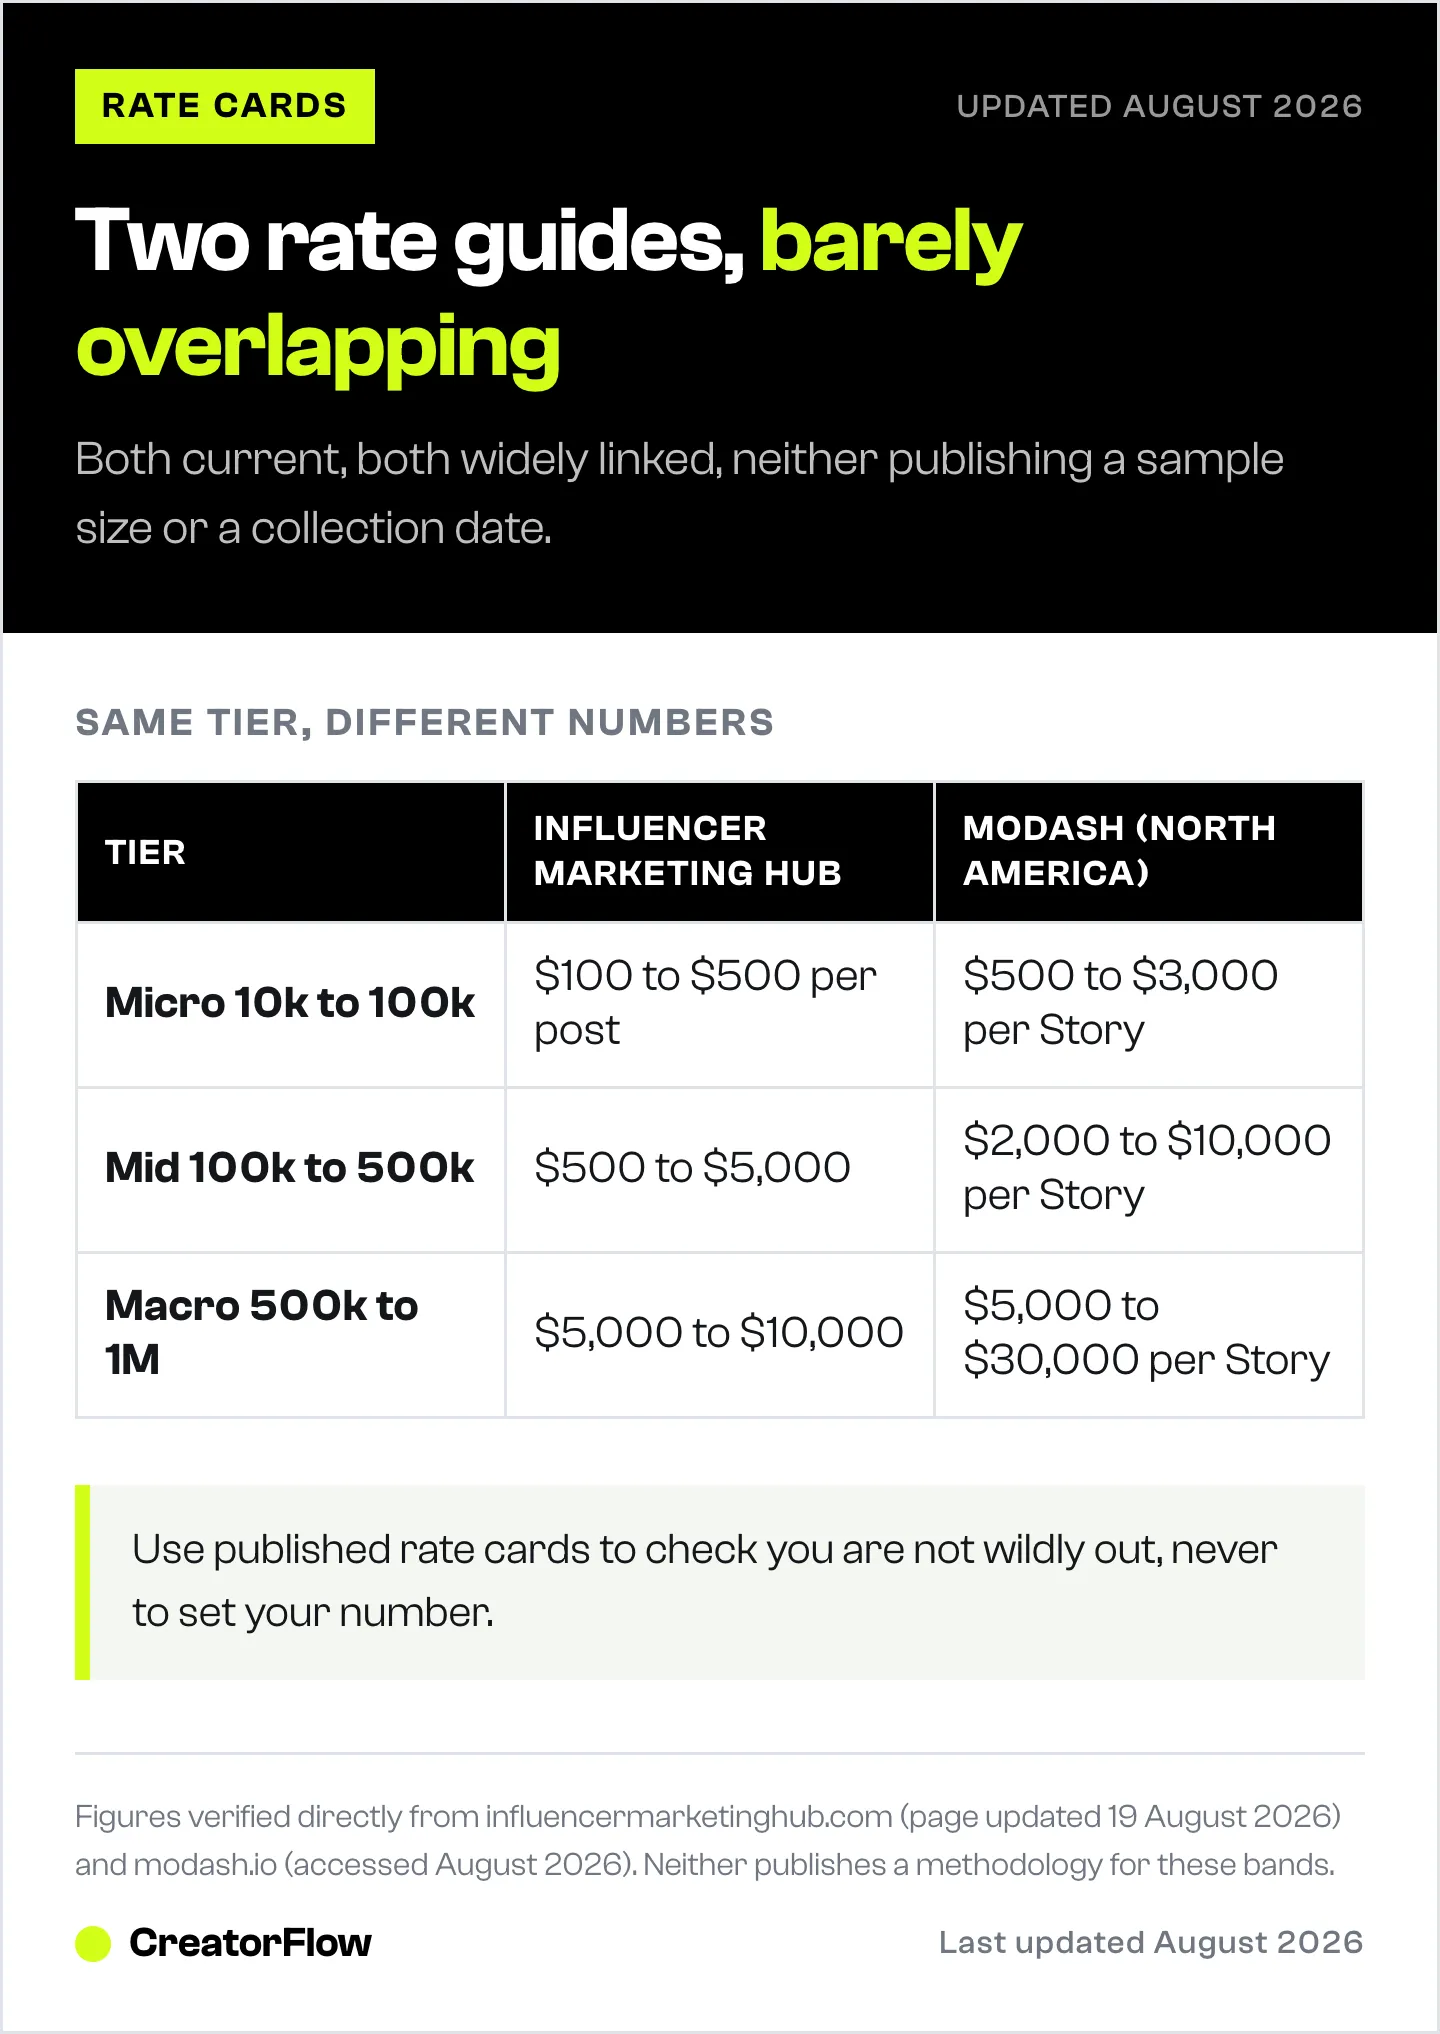
| Tier | Influencer Marketing Hub | Modash (North America) |
|---|---|---|
| Micro (10k to 100k) | $100 to $500 per feed post | $500 to $3,000 per Story, $750 to $5,000 per Reel |
| Mid-tier (100k to 500k) | $500 to $5,000 | $2,000 to $10,000 per Story, $5,000 to $20,000 per Reel |
| Macro (500k to 1M) | $5,000 to $10,000 | $5,000 to $30,000 per Story, $10,000 to $50,000 per Reel |
| Mega (1M+) | $10,000 and up | $30,000+ per Story, $50,000+ per Reel |
Sources: influencermarketinghub.com (last updated 19 August 2026) and modash.io (accessed August 2026).
At the micro tier those two sets barely overlap. At the macro tier one guide’s ceiling is one fifth of the other’s. Both are current, both are widely linked, and a creator reading either one in isolation would price with confidence.
The reason is that they are measuring different things and neither says so clearly. One appears to describe a static feed post, the other separates Stories and Reels and is drawn from a tool vendor’s view of North American deals. Neither publishes a sample size or a collection date for the underlying numbers. Influencer Marketing Hub’s page references industry analyses generically without a methodology statement.
The UK picture is the same. Searching for UK micro-influencer rates in August 2026 returns at least four different published ranges for overlapping follower bands: £50 to £250, £100 to £500, £250 to £1,000 and £250 to £1,500. They cannot all be right, and there is no way from the outside to tell which is closest.
Why Country Rate Cards Are Unreliable
Four structural reasons, and they are not going away.
Nobody has the data. Brand deal fees are private, contained in contracts with confidentiality clauses. There is no filing requirement and no public registry. Any country table is either a survey with a small self-selected sample or an estimate.
Audience location is not creator location. A creator based in Portugal with a 70% United States audience is priced on the United States audience, because that is who the brand is buying. Sorting rates by the creator’s country measures the wrong variable.
Category swamps geography. Finance, software and health consistently pay above fashion and lifestyle for the same reach. A country average blends categories with genuinely different economics and produces a number that describes nobody.
The unit is undefined. A “post” might be one in-feed Reel, or a Reel plus three Stories plus twelve months of paid usage. Two quotes for the same product can differ by five times, and the tables rarely say which they are pricing.
The practical consequence: use published rate cards to check you are not wildly out, never to set the number.
The One Country Figure With a Method Behind It
The exception is CPM data, and it is the most useful published input available.
For the DACH market, covering Germany, Austria and Switzerland, Modash publishes CPM bands attributed to a named practitioner, Anna-Maria Klappenbach, described as drawn from hundreds of collaborations over a two-year period: Instagram Stories landing in the EUR 25 to EUR 45 CPM range, rarely above EUR 35, and Instagram Reels between EUR 10 and EUR 50, most often in a similar range to Stories (modash.io, accessed August 2026).
That is worth more than any follower table for three reasons. It names a person and a basis. It prices reach rather than followers, which is the thing brands are buying. And it converts directly into a number for your account.
Germany is a market worth pricing properly. It is one of the larger creator economies in Europe, and rates there sit closer to the higher end of European CPM bands than most creators assume.
Price From Your Own Reach
The method that survives contact with reality, in four steps.
Step one: find your real median. Take your last ten to fifteen posts of the format being bought. Use the median views or reach, not the average, because one outlier Reel will distort it badly. Screenshot the insights.
Step two: pick a CPM band. For a European audience, the DACH Stories band of EUR 25 to EUR 45 is the best-sourced anchor available. For a United States audience, expect higher, since US and Western European audiences are consistently described as the higher-CPM markets. Position yourself in the band by category and engagement, not by hope.
Step three: multiply.
(median reach ÷ 1,000) × CPM = base fee
A Reel with a median reach of 40,000 at a EUR 30 CPM gives a base fee of EUR 1,200. That number has a defensible derivation, which matters when a brand asks how you arrived at it.
Step four: add the extras as separate lines. Usage rights beyond organic, exclusivity, whitelisting, and additional formats each carry their own fee. These regularly exceed the base fee on larger deals, and they are where creators quietly give value away. What each clause is worth and how to negotiate it is in brand deal contracts and what to check before signing.
The advantage of this method over a rate card is that it is arguable. “Forty thousand people at a thirty euro CPM” is a conversation a marketing manager already knows how to have, because it is how they buy every other media placement.
What Actually Moves Instagram Brand Deal Rates
In rough order of impact, and none of these is your country.
- Audience location. United States and Western European audiences command higher CPMs than the global average.
- Category. Finance, software, health and home improvement pay above general lifestyle.
- Format. Reels and video price above static and above Stories in every published set, which is generally attributed to production time.
- Usage and exclusivity. Perpetual rights or category exclusivity should multiply the fee, not come free.
- Engagement quality. Saves, shares and comments from real accounts. A brand’s own vetting looks at this before it looks at follower count.
- Whether you have proof. Screenshots of results from previous deals move a negotiation more than any benchmark does.
That last one compounds. Keep the insights from every paid post, and the next negotiation starts from evidence about your account rather than an argument about a table on the internet. The record-keeping that supports it sits alongside the invoicing process in how to invoice a brand for an Instagram collaboration.
Where DM Data Strengthens Your Case
Reach is what most creators sell. Demonstrated action is worth considerably more and almost nobody brings it to the table.
If your posts drive comment-triggered DMs, you can show a brand how many people asked for the link, how many clicked, and where in the world they were. That converts the pitch from “40,000 people will see this” to “40,000 people saw the last one and 900 asked for the link”. Brands buying performance rather than awareness will pay differently for the second sentence.
CreatorFlow tracks clicks and geography per automation through Meta’s official Instagram API, so the country breakdown you show a brand comes from your own audience rather than from an industry average. That geographic split is also the most direct answer to “who is your audience”, which is the question underneath every rate negotiation. Setting the mechanism up is covered in the Instagram DM automation guide, and if you are still building the deal pipeline, how to get brand deals on Instagram covers the outreach.
FAQ
What should a UK creator charge for an Instagram Reel?
Published UK guides give ranges for the same follower band that differ by roughly five times, so no single figure is safe to quote. Take your median reach on Reels, apply a CPM band for your audience’s location, and treat the published tables as a sanity check rather than a source.
Are influencer rates higher in the US than in Europe?
United States audiences are consistently described as a higher-CPM market, and rate guides quoted in dollars sit above their euro equivalents. What matters for your own pricing is where your audience is, not where you are, because the brand is buying access to those people.
What is a good CPM for an Instagram brand deal?
For the German-speaking market, published practitioner data puts Instagram Stories at EUR 25 to EUR 45 CPM, rarely above EUR 35, with Reels between EUR 10 and EUR 50 (modash.io, August 2026). Treat it as an anchor and position within the band by category and engagement.
Why do influencer rate cards disagree so much?
Because the underlying data is private, most published tables have no stated methodology, and the unit being priced is rarely defined. One guide may be pricing a single static post while another prices a Reel with usage rights attached.
Should you put your rate card on your media kit?
Put a starting rate rather than a fixed table. “Reels from EUR 1,200” sets a floor, filters brands with no budget, and leaves room to price usage, exclusivity and format properly once you know what the deal involves. The rest of the kit, from audience numbers to a results page, is covered in what to include in a media kit.
How do you justify your rate to a brand?
Show the derivation. Median reach on the format they want, the CPM you are applying, and the extras itemised separately. A number with arithmetic behind it is much harder to negotiate down than a number that appeared from a rate card.
Does follower count still decide what you get paid?
Less than the tables imply. Brands increasingly price on reach, engagement quality and audience location, all of which a follower count only loosely predicts. An account with 20,000 followers and high reach can price above one with 80,000 and low reach.
Rate figures verified directly from influencermarketinghub.com (page last updated 19 August 2026) and modash.io as of August 2026. No country-level rate dataset with a published methodology was found during that research; the ranges described as contradictory are the ranges those sources publish. Fee calculations shown are illustrative arithmetic, not measured results. Individual results vary.


