

Instagram ads cost roughly $0.20 to $2.00 per click and $2.50 to $15 per 1,000 impressions across the five vendor benchmarks compared here. Meta’s own pricing page gives no average, because each ad price comes from an auction. Your objective, audience and ad quality move the number. Meta’s recommended start is a budget of at least $5 and a duration over six days.
Search for a price and you get five answers. One page says $2.50 to $3.50 per 1,000 impressions. Another says about $14. Both can be correct, because they describe different campaigns, different years and often Facebook as well as Instagram. A budget built on one of those numbers is a budget built on someone else’s account.
This guide shows the spread with each number labelled as that vendor’s, then explains what Meta itself says about pricing and budgets. After that comes the sum most guides skip, which is the most you can pay for a sale or a lead. It is written for creators, coaches and small ecommerce brands spending their own money. The worked examples are illustrative, so replace them with your own numbers.
Key Takeaways
- No official price: Meta says there is no one-size-fits-all answer and its pricing page lists no average. Every benchmark below belongs to a vendor.
- A wide spread: Five vendor pages put cost per click between $0.20 and $2.00 and CPM between $2.50 and about $15, using different dates, samples and definitions.
- Budget floor: Meta recommends starting with at least $5 and a duration over six days. The required minimum varies by country and objective.
- Results need budget: Meta says an ad set usually leaves the learning phase after about 50 results in a week. At $30 per result, that is about $1,500 a week.
- Start from the sale: Order value times gross margin gives your limit per sale. That limit times your conversion rate gives your limit per click.
- Bottom line: A click price tells you little until you know your limit per sale. Run a small test, then compare your own cost per sale with that limit.
How Much Do Instagram Ads Cost? Five Sources Compared
Instagram ads cost between $0.20 and $2.00 per click and between $2.50 and about $15 per 1,000 impressions in the five vendor pages below. None of these figures comes from Meta. Cost per lead runs from $3 to $48, and cost per sale from $5 to $75 or more, so the numbers closest to revenue disagree the most.
| Source and page date | Cost per click | Cost per 1,000 impressions (CPM) | Cost per lead | Cost per sale |
|---|---|---|---|---|
| Admetrics, May 2026 | $0.50-$2.00 | $5-$15 | - | $10-$60 |
| Holo, 2025 | $0.50-$2.00 | $2.50-$3.50 for well-run campaigns, about $10.81 as a wider average | - | $5-$75 or more |
| Neil Patel, updated August 2025 | $0.20-$2.00 | $6-$10 | $3-$15 | $20-$50 for ecommerce |
| Quimby Digital, 2026 | $0.70-$1.35 | About $14 | $35-$48 | $30-$50 |
| Buffer, April 2025 | $1.36 | $13.66 | - | - |
A dash means the figure is not part of this comparison. Every figure is the vendor’s own, read from its page in October 2026.

The pages also differ in where the numbers come from. Admetrics calls its ranges industry benchmarks, and Holo gives its ranges for 2025. Neither page names an outside source. Neil Patel’s page credits WordStream research, and its link goes to a WordStream post from February 2021, so the page is newer than its data. Quimby Digital credits Triple Whale, WordStream and Birch, and Buffer’s figures come from Birch data as of February 2025.
Why Do Instagram Ad Cost Benchmarks Disagree?
The benchmarks disagree because they measure different things. They use different years, different campaign objectives, different click definitions and often data for all of Meta instead of Instagram alone. Treat each number as a description of one sample. Your own Ads Manager results after a first test will tell you more than any of them.
Objective. Quimby Digital, citing a Q1 2026 US dataset from Affect Group, reports these Meta CPM ranges by campaign goal. Meta’s own pricing overview says your objective “plays a large role” in cost.
| Campaign goal | Reported Meta CPM range |
|---|---|
| Reach or impressions | $9-$14 |
| Traffic or engagement | $10-$15 |
| Sales | $14-$25 |
| Website lead generation | $26-$40 |
Platform. Buffer labels its figures as Instagram costs, and it describes the Birch data behind them as Facebook advertising costs. Part of Quimby Digital’s click data comes from WordStream’s Facebook benchmarks. A number on an Instagram page is often a Meta number.
Shared sources. Buffer’s $1.36 and the $1.34 per link click that Quimby Digital reports for July 2026 look like two sources in agreement. Both trace back to Birch, so they count as one.
What counts as a click. Meta’s clicks (all) metric can include reactions, comments, shares and taps to expand a photo. Its link clicks metric counts clicks on links to the destination you chose. Ads Manager reports a cost for each, and the cost per link click is the one to use in the sums below.
Date. Search excerpts of Triple Whale’s Meta benchmarks, which combine Facebook and Instagram, show CPM rising from $13.30 to $15.06, up 13.24%, between the 12 months to July 2025 and the 12 months to July 2026. In the same period, cost per acquisition rose from $37.80 to $38.99, up 3.14%. Triple Whale’s site blocked our direct read, so we could not confirm these figures on the page itself.
If those excerpts are right, CPM rose about four times as fast as cost per acquisition in that data. So a change in CPM on its own does not tell you what a sale costs.
How Does Meta Decide What an Instagram Ad Costs?
Meta runs an auction each time it can show someone an ad. The winner is the ad with the highest total value, which combines your bid, the estimated chance that the person acts, and ad quality. A more relevant ad can beat an ad with a higher bid, so two advertisers can pay different prices for the same audience.
Meta’s ad auction help page adds two details that vendor guides often leave out (checked October 2026). A price floor may affect whether an ad is shown and the price paid. Meta may also adjust auctions, but it says those adjustments will not charge you more than your bid.
The same page says ad quality draws on feedback such as people hiding an ad, and on signals such as withheld information and engagement bait. So the wording of your ad is part of your price.
Cost per click, CPM, cost per lead and cost per sale are all the same spend divided by a different outcome. You set a budget and a bid strategy, the auction runs, and Ads Manager reports what each outcome cost you.
What Is the Minimum Budget for Instagram Ads?
Meta recommends starting with at least $5 and a duration over six days, and it asks for enough budget to run for at least seven days. It gives no single required minimum on its help page. It says the minimum varies by country and objective, and that Ads Manager shows an alert if your budget is too low.
Meta’s pricing overview words the $5 as “at least $5 for your budget” (checked October 2026). The page does not say per day or in total. Its minimum budgets page says requirements also consider your business vertical, budget type, bid strategy and currency.
A daily budget is an average, not a hard cap on one day. Meta’s daily budget page says it may spend up to 75% over on a good day, and that weekly spend will not go above seven times the daily budget. So a $100 daily budget can spend $175 on one day and no more than $700 in the week. You can pause an ad at any time, though you may still get a bill for charges from before the pause.
The floor that matters more is the number of results. Meta’s learning phase page says ad sets usually leave that phase after about 50 results in the week after the last significant edit. That gives you a practical way to size a budget.
| Cost of one result | Weekly spend for 50 results | Per day |
|---|---|---|
| $1 (for example, a landing page view) | $50 | About $7 |
| $5 | $250 | About $36 |
| $30 (for example, a sale) | $1,500 | About $214 |
This table is arithmetic from Meta’s “about 50”, and the costs per result are examples. At $5 a day you can pay for one $30 sale every six days, so the system has little to learn from. Meta’s own advice for a smaller budget is to pick an event that is easier and cheaper to reach. If you set a cost per result goal, Meta also asks for a daily budget of at least five times that goal, so a $5 goal needs at least $25 a day.
How to Work Out the Most You Can Pay Per Sale or Lead
Start with the profit on one sale. Multiply order value by gross margin to get the most you can pay per sale. Multiply that by your conversion rate to get the most you can pay per click. For lead ads and other lead campaigns, multiply your profit per sale by your close rate. Then compare those limits with your own Ads Manager numbers.
Four short formulas cover it:
- Limit per sale = order value × gross margin
- Limit per click = limit per sale × conversion rate
- Limit per 1,000 impressions = limit per click × click-through rate × 1,000
- Limit per lead = profit per sale × close rate
Take a $60 product with a 50% gross margin, so your limit per sale is $30. This table shows what that means for the click price you can accept.
| Conversion rate on the page | Most you can pay per click |
|---|---|
| 1% | $0.30 |
| 2% | $0.60 |
| 3% | $0.90 |
| 4% | $1.20 |
| 5% | $1.50 |
A $0.20 click makes money on this product at any rate in the table. A $2.00 click loses money at all of them. Buffer’s $1.36 needs a conversion rate of about 4.5% to break even. The same click price is a profit for one store and a loss for another.
Two adjustments keep the limit honest. Add a measured repeat purchase rate if you have one, because a customer who buys twice can justify a higher first-sale cost. Do not estimate it. Then count the costs outside the ad account, such as design, tools and your own time. Our guide to calculating social media ROI lists the lines people forget.
What Does $300 a Month Buy? A Worked Example
This example is illustrative, not a benchmark. A $60 product with a 50% gross margin, a $14 CPM and a 1% click-through rate gets about 214 clicks from $300. At a 2% conversion rate that is about 4 sales at $70 each, against a $30 limit. The account loses about $171 before any repeat purchases.
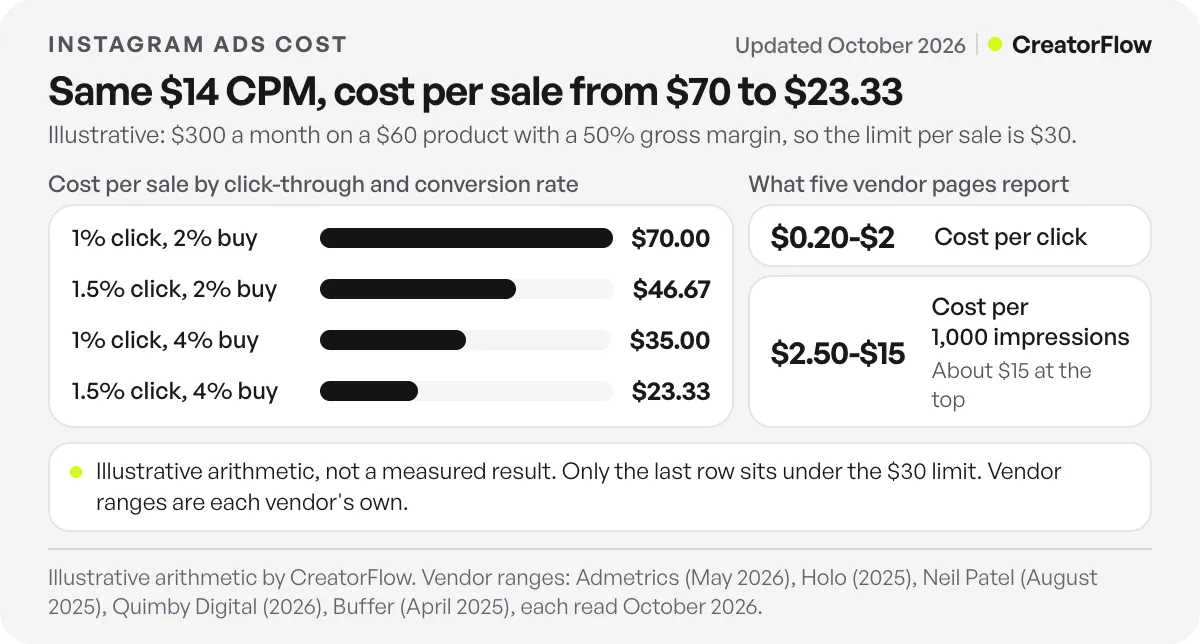
Here is the same $300 at the same CPM, with two inputs changed. All numbers are illustrative arithmetic.
| Scenario | Clicks | Cost per click | Sales | Cost per sale | Gross profit minus ad spend |
|---|---|---|---|---|---|
| 1% click-through, 2% conversion | 214 | $1.40 | 4.3 | $70.00 | -$171 |
| 1.5% click-through, 2% conversion | 321 | $0.93 | 6.4 | $46.67 | -$107 |
| 1% click-through, 4% conversion | 214 | $1.40 | 8.6 | $35.00 | -$43 |
| 1.5% click-through, 4% conversion | 321 | $0.93 | 12.9 | $23.33 | +$86 |
The CPM never moved, and cost per sale went from $70 to $23.33. The two things that moved it were the ad and the page or offer behind it. Doubling the order value to $120 at the same margin has the same effect as doubling conversion, and the baseline goes from -$171 to -$43.
To lower creative risk before you pay for reach, you can test a Reel with Trial Reels and promote the winner.
The same sum for leads. Take a $500 coaching offer with a 70% margin, so $350 profit per sale. If 1 lead in 10 buys, your limit per lead is $35. Quimby Digital’s $35-$48 range sits at or above that limit, and Neil Patel’s $3-$15 range sits well below it. Your own test shows which one applies to you, and your close rate matters as much as the ad.
Do Click-to-DM Ads Change the Cost?
Click-to-DM ads go through the same auction, so no separate price list applies to them. They change what you buy, which is a conversation instead of a page visit. Since September 28, 2026, a chat that starts from one of these ads can stay open for up to 7 days from the person’s first message, instead of the standard 24 hours.
Meta’s Instagram messaging changelog records the change for Click-to-Direct and Click-to-Messenger ads, and says chats from other entry points stay within 24 hours (checked October 2026). This matters for cost because you already paid for that chat. With 24 hours, a slow reply could waste the spend. With up to 7 days, you have time to answer properly and send a follow-up.
Measure it with the same sum. Divide spend by conversations, then divide by the share of conversations that buy. As an illustration, $300 that starts 40 chats costs $7.50 per chat. If 1 chat in 5 buys, your cost per sale is $37.50. Compare that with the same product on a link-out ad, not with a click price. Our click-to-DM ads playbook for ecommerce covers the message sequence behind the ad.
When Are Instagram Ads Worth the Cost?
Instagram ads are worth the cost when your own test shows a cost per sale or lead under your limit, or when a measured repeat rate covers the gap. They also buy reach to people who have never seen you, on the day you choose. Ads are harder to justify when your limit per sale is too low to pay for a real test.
Ads and comment-to-DM do different jobs, so compare them by job. Ads buy new attention at auction prices. Comment-to-DM on Instagram works with attention your posts and Reels already get: someone comments a keyword and receives your link by DM. Meta allows one private reply per comment, within 7 days of the comment, and only one message until the person replies.
Many accounts use both, and the order follows the numbers. If people already comment and ask for your link, answering every one of them is the cheaper first step. CreatorFlow has a $0 Free plan, and Pro is a flat $15 a month or $144 a year. If your posts do not yet reach enough of the right people, a small ad test may teach you more. To compare the two, use the same sum, and see our breakdown of Instagram automation ROI.
A fair objection to this whole method is that first-sale math can undersell ads. Ads can also lift branded search, followers and later purchases that no single report ties to the ad. That is true, and it is hard to measure on a small budget. Treat those effects as a bonus until you can measure them.
FAQ
How much do Instagram ads cost per day?
No fixed daily price exists. You set the budget, and Meta recommends starting with at least $5 and a duration over six days. Quimby Digital describes a $10 a day test as about $300 a month. Your daily spend can go up to 75% over a daily budget on some days, while the week stays within seven times that budget.
What is a good CPM for Instagram ads?
Vendor pages put CPM between $2.50 and about $15, and none of those figures comes from Meta. A good CPM is one that leaves your cost per sale under your limit. A $14 CPM can be profitable with a strong ad and page, and a much lower CPM can still lose money if few people buy.
What is a good cost per click on Instagram?
Work it out from your own product. Multiply your limit per sale by your conversion rate. With a $30 limit and a 2% conversion rate, you can pay up to $0.60 per click. Use cost per link click for this sum, since clicks (all) can include reactions and comments.
Can I run Instagram ads for $5?
Yes, Meta names at least $5 as the recommended starting budget. It will not buy many sales at a typical cost per sale, so use it to test an ad or to reach a cheaper event such as a landing page view. Keep the test running for at least seven days so Meta has time to learn.
Why are my Instagram ads more expensive than the benchmarks?
Benchmarks describe other accounts, so a gap on its own is not a fault. Your objective, audience, ad quality and timing all change the price. In the Quimby Digital ranges above, lead campaigns pay a higher CPM than reach campaigns, and season matters too. A search excerpt of Triple Whale’s Black Friday and Cyber Monday 2025 page gives a Meta CPM of $22.26.
Do click-to-DM ads cost less than link ads?
There is no separate price list, and the auction sets the cost for both. Compare them by cost per sale from your own test. A click-to-DM ad can cost more per click and still win if more of those conversations end in a purchase. It can also lose if your product needs no questions answered.
Sources and checks
Checked October 30, 2026: Meta’s pricing overview, ad auction, daily budget, minimum budget and learning phase help pages, and its Instagram messaging changelog. Benchmark figures are each vendor’s own, from the pages linked in the comparison table and from Triple Whale. Triple Whale’s site blocked direct reads, so its figures come from search excerpts. The worked examples are illustrative arithmetic, not measured results, and your costs will differ.