

The Instagram retention graph shows what share of viewers is still watching at each moment of your Reel. It always slopes down. Read it in three places: the first 3 seconds, which Instagram reports as skip rate, the steepest drop after that, and any flat stretch where viewers stay. Flat stretches mark your best material. Move it earlier, and put your ask before the line falls.
Most creators open the graph, see the line drop and close Insights again. A falling line looks like bad news, so the useful part gets skipped. The graph does more than grade the Reel. It shows you the exact second where your viewers got what they came for, and how many of them were still there when it arrived.
This guide covers where to find the graph, what each shape of curve tells you, how to measure the seconds before your first payoff, where your comment keyword belongs, and how to recut a Reel using the numbers. It is written for creators and small businesses who post Reels and want both reach and replies from them.
Key Takeaways
- The graph always falls: Instagram’s own guidance is that you will always see a downward slope, and the flatter the line, the more engaged your audience is.
- Skip rate is the first 3 seconds: Instagram defines it as the percentage of views from people who skipped your Reel in those first 3 seconds.
- Flat stretches are your best material: where the line levels out, viewers found something worth staying for. Open the next Reel with it.
- Count the seconds to your first payoff: the share of viewers still watching at that second is the share who got any value at all.
- Put the comment keyword before the drop: a call to action only reaches the viewers still watching when you say it.
- Test the recut against the original: Trial Reels go to non-followers first, so you can compare two versions without posting both to your followers.
Where to Find the Instagram Retention Graph
Open a Reel on your professional account, tap View insights and scroll to the retention section. Instagram’s Help Center says insights need a public account, personal or professional. Instagram added the retention chart and skip rate to Reel insights in August 2025, as Social Media Today reported, replacing the older view rate.
The chart plots time along the bottom and the share of viewers still watching up the side. Skip rate sits next to it as a single number. Give a new Reel at least 48 hours before you judge it, because the early audience is mostly your followers and the curve often changes once it reaches strangers.
What Does the Retention Graph Show?
The retention graph shows the percentage of viewers still watching at each second of your Reel. Skip rate is the percentage of views from people who left in the first 3 seconds. Instagram describes retention as the moments in your Reel that keep or lose viewers’ interest. A line that drops fast lost them. A line that stays flat held them.
Two numbers matter more than the rest:
- The height after second 3. This is the share of viewers who passed the opening. Everything later in the Reel can only reach people who are still above this line.
- The slope of each stretch. A steep stretch is where people leave. A flat stretch is where they stay. A small rise can mean people scrubbed back to watch a moment again.
Watch time feeds ranking directly. Adam Mosseri said in January 2025 that watch time, likes and sends are the three signals that matter most. The retention graph is the second-by-second view of the first of those.
Four Curve Shapes and What Each One Tells You
Every retention graph slopes down, so the shape matters more than the height. Most Reels fall into one of four shapes.
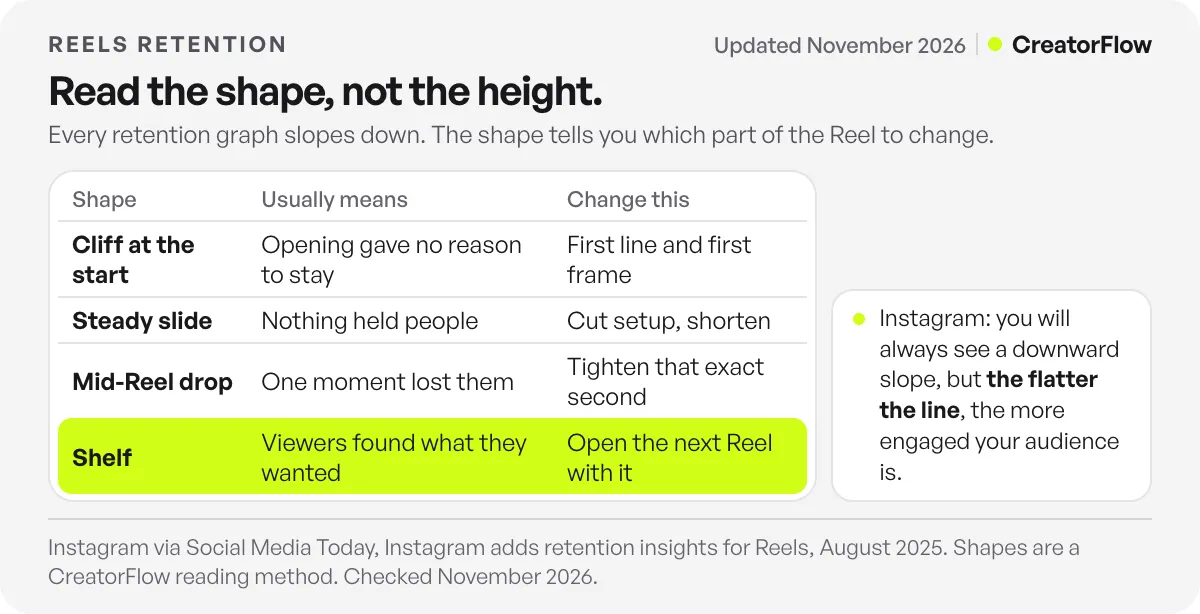
| Shape | What you see | What it usually means | What to change |
|---|---|---|---|
| Cliff at the start | Line drops hard in the first 3 seconds, then flattens | The opening did not tell the viewer why to stay | Rewrite the first line and first frame. Keep the rest |
| Steady slide | Line falls at the same rate the whole way | No single moment held people; the Reel is long for what it says | Cut setup and repeated lines. Shorten |
| Mid-Reel drop | Line holds, then falls at one point | Something at that second lost them: a long pause, a slow shot, a topic change | Watch that exact second and cut or tighten it |
| Shelf | Line falls, then levels out for several seconds | Viewers found what they came for here | Move this part to the start of your next version |
The shelf is the most useful shape and the most ignored. It answers a question no other metric does: which part of this video did people want? Very often it is a list, a number, a result or a demonstration that sits 10 or 15 seconds in, after an introduction nobody needed.
A cliff at the start has two possible causes. Either the opening line was weak, or the Reel reached people who were never going to care about the topic. If Insights shows most views came from non-followers and the cliff is steep, check the topic word you used in the hook and caption. A word that several unrelated audiences share sends your Reel to the wrong people. Our guide to Instagram SEO has a two-minute search test for this.
Count the Seconds Before Your First Payoff
Your first payoff is the first moment a viewer gets something useful: a tip, a number, a result on screen, the answer to the hook. Everything before it is a cost the viewer pays to reach it.
Measure it in five steps:
- Play the Reel and stop at the first useful moment. Write down the second.
- Read the retention graph at that second. Write down the percentage.
- That percentage is the share of viewers who got any value at all. Everyone else left before the Reel gave them a reason to stay, follow or reply.
- List what happens before that second. Usually it is an introduction, a “today I’m going to show you”, or a slow first shot.
- Cut or move it. Lead with the payoff, and add context after it if the viewer still needs it.
If the first payoff lands at second 12 and the graph reads 25% there, three of every four viewers left without getting anything. Bring the same payoff to second 1 and it reaches nearly everyone who passed the opening. Short Reels are not the point. A 60-second Reel that delivers at second 1 and keeps delivering will hold better than a 20-second Reel that delivers at second 15.
Our 50 Instagram hook templates are built for this step. Each one opens on the result or the problem, not on an introduction.
Put Your Comment Keyword Before the Curve Falls
A call to action only reaches the people still watching when you say it. If your Reel asks viewers to comment a keyword in the last 5 seconds, the graph tells you how many heard the ask.
Here is illustrative arithmetic, not a measured result. A Reel gets 10,000 views. The ask comes at second 40, where the graph reads 15%. Only about 1,500 viewers hear it. Move the same ask to second 8, where the graph reads 45%, and about 4,500 viewers hear it. The Reel did not get more views. Three times as many people were asked.
Three rules follow:
- Say the keyword early, then repeat it. Mention it right after your first payoff, show it on screen, and say it again at the end for the people who stayed.
- Put it in the first line of the caption too. People read captions without finishing the video, so the caption catches viewers who left the graph early.
- Give one keyword and one reward. “Comment GUIDE for the checklist” is clear. Two keywords for two different things split the replies.
When someone comments your keyword, CreatorFlow sends the private reply in a DM within seconds, so the viewer gets the link or resource while they still remember the Reel. Our guide to turning Reels views into DMs covers how to build the full sequence around it.
How to Recut a Reel Using the Retention Graph
You do not need to film again to act on the graph. Most Reels can be recut from the same footage in under an hour.
- Find the shelf or the first payoff on your best recent Reel.
- Open the new cut with that moment. If there is a strong visual from that section, use it as the first frame.
- Rewrite the on-screen hook as the result. Name what the viewer gets, in their words.
- Cut everything before the payoff that the viewer does not need, including greetings, setup and the topic announced twice.
- Move the comment keyword to right after the first payoff, and keep a second mention at the end.
- Post the recut as a Trial Reel. Instagram’s Trial Reels are shown to non-followers first, and results appear after about 24 hours. Compare the skip rate and the height at your payoff second against the original.
Change one thing per test if you can: the opening, or the length, or the position of the ask. Two changes at once tell you the new version won, but not why. Our guide to Instagram Trial Reels covers eligibility and setup.
What Is a Good Retention Rate on Instagram Reels?
Instagram does not publish a benchmark for retention or skip rate. Any fixed target you read online, such as a skip rate under 30%, comes from third-party tools, not from Instagram. The most reliable benchmark is your own: compare each new Reel with your last 10 Reels of a similar length.
Two published datasets give context:
| Source | What it measured | Finding |
|---|---|---|
| Metricool 2026 Instagram study | 24.36 million posts from 375,118 accounts, early 2025 vs early 2026 | Average Reel watch time more than doubled to 8.5 seconds |
| Socialinsider Reels length study | About 9.8 million brand Reels, January to June 2026 | 45 to 60 second Reels had the highest engagement rate and median views; Reels over 3 minutes scored far lower |
An 8.5-second average means most viewers give a Reel only a few seconds. That is why the opening and the first payoff carry so much weight. For how long a Reel can run and which lengths reach most people, see how long Instagram Reels can be. For the other numbers worth tracking each week, see our guide to Instagram analytics.
FAQ
How do I see the retention graph on Instagram Reels?
Open the Reel on a professional account, tap View insights and scroll to the retention section. It shows the share of viewers still watching at each second, with skip rate next to it. Insights need a public account, personal or professional.
What is skip rate on Instagram?
Skip rate is the percentage of views from people who skipped your Reel in the first 3 seconds. Instagram added it to Reel insights in August 2025, replacing view rate. A lower skip rate means more viewers passed your opening.
What is a good skip rate on Instagram Reels?
Instagram does not publish one. Compare each Reel’s skip rate with your own last 10 Reels. If a new opening brings your skip rate below your usual range, keep that style of opening and test it again.
Why does my retention graph drop so fast?
A fast drop in the first seconds usually means the opening did not show viewers why to stay, or the Reel reached people who do not care about the topic. Check whether most views came from non-followers and whether your topic word is used by other audiences.
What does a flat line on the retention graph mean?
A flat stretch means viewers stayed through that part. Instagram says the flatter the line, the more engaged your audience is. Find what you showed or said there and open your next Reel with it.
Where should I put the call to action in a Reel?
Right after your first payoff, then again at the end. A call to action only reaches the viewers still watching, so an ask in the last seconds reaches the smallest group. Put the keyword in the first line of the caption as well.
Does retention affect Instagram reach?
Yes. Adam Mosseri said in January 2025 that watch time is one of the three signals that matter most for ranking, together with likes and sends. The retention graph shows where that watch time is won and lost.
A retention graph is the closest thing Instagram gives you to watching over your viewers’ shoulders. Read it for the seconds where people stay, and build the next Reel around them.
Sources and checks
Retention chart, skip rate definition and Instagram’s “flatter the line” guidance as reported by Social Media Today, August 2025. Ranking signals from Adam Mosseri, January 2025, via Social Media Today. Trial Reels from Instagram’s creators blog, December 2024. Watch time data from Metricool (June 2026) and length data from Socialinsider (updated October 2026). All checked November 2026. The 10,000-view example is illustrative arithmetic, not a measured result.